A vacant apartment for 30 days, a repair invoice that arrives without context, or rent that is collected late can change the economics of an investment fast. A rental property KPI dashboard for investors turns these moving parts into a clear operating picture. For owners in Tbilisi who live abroad or manage multiple units, it provides control without requiring daily calls to tenants, contractors, and building representatives.
The point is not to create another spreadsheet to review once a year. It is to see whether each property is producing the income you expected, where costs are rising, and whether a small issue is becoming a larger risk. A good dashboard gives an owner the right questions to ask and gives the local management team a disciplined way to act.
What a Rental Property KPI Dashboard Should Show
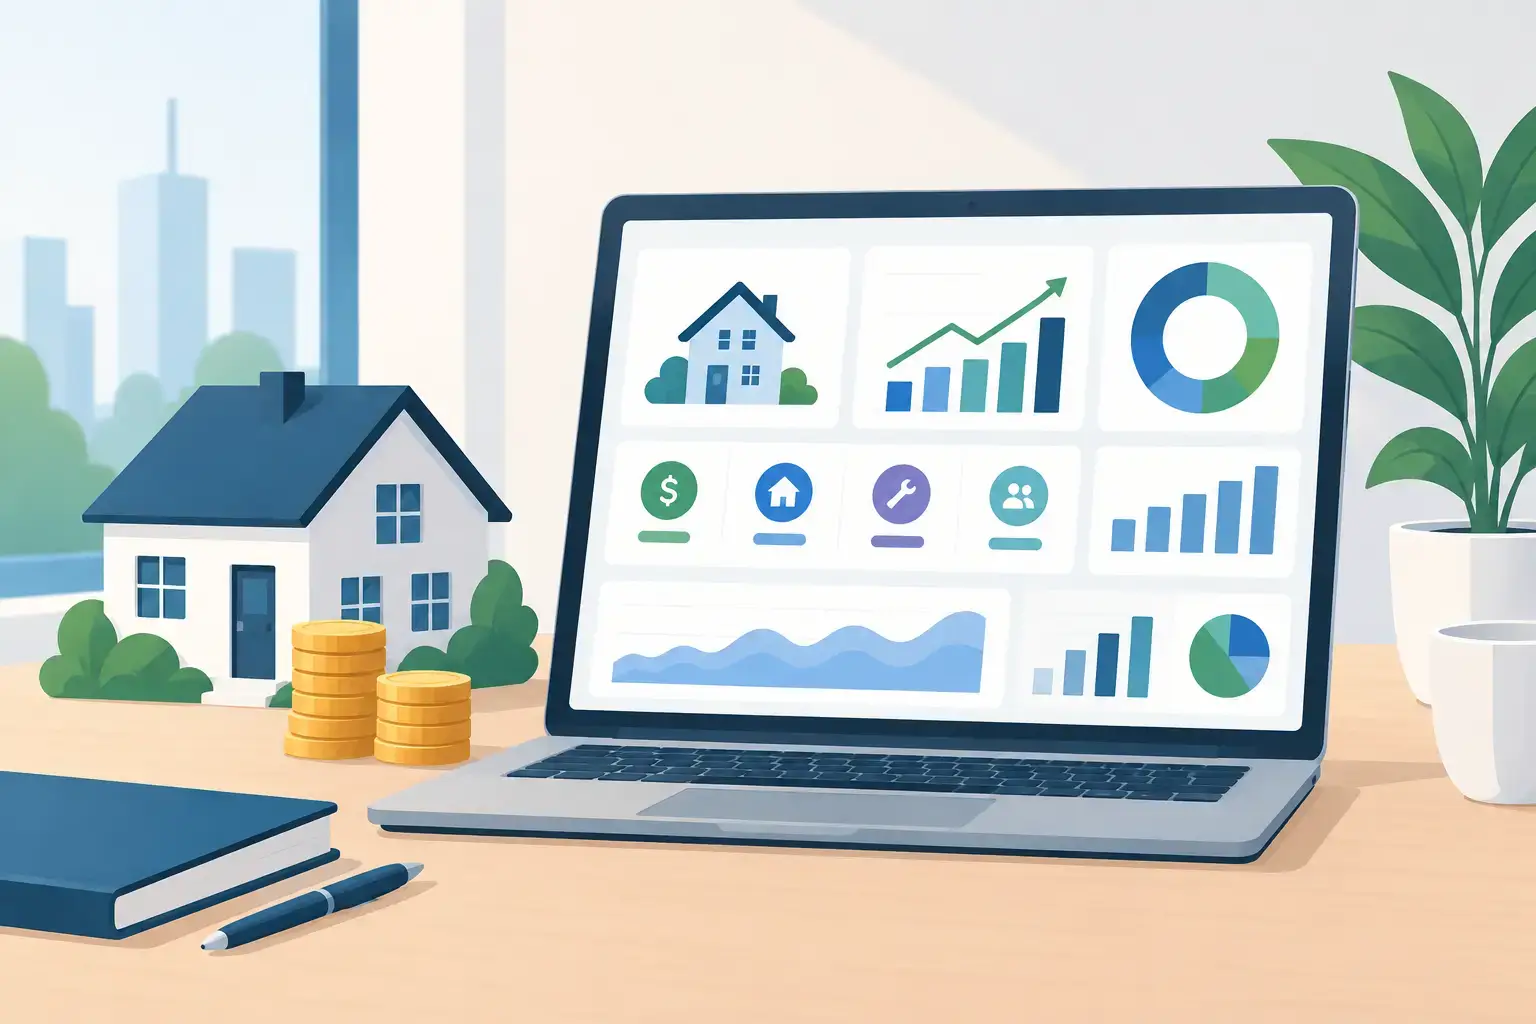
Your dashboard should start with the numbers that affect cash flow and asset protection. Fancy charts are optional. Accurate, current information is not.
At the portfolio level, an investor should be able to see collected rent, occupancy, operating expenses, maintenance spending, and net cash flow for the current month and year to date. At the unit level, the view should show lease status, tenant payment history, current rent, next renewal or move-out date, and open maintenance items.
For a Tbilisi rental property, this matters because returns are often affected by operational details rather than the purchase price alone. A unit may look profitable on an annual projection but underperform because it sits vacant between tenants, is priced incorrectly for its location and condition, or needs repeated repairs that were not addressed at the source.
A practical dashboard separates planned costs from unexpected costs. Management fees, cleaning between tenants, utility balances, building charges, tax-related payments, furnishing replacements, and repairs should not be blended into one vague expense line. When costs are categorized, an owner can tell the difference between a normal turnover expense and an issue that requires attention.
The Core KPIs That Protect Rental Returns
Collected Rent vs. Scheduled Rent
Scheduled rent is what tenants are expected to pay. Collected rent is what actually reached the owner account. The gap between the two is one of the most useful performance indicators in rental operations.
A dashboard should show both figures, along with any late balances and the number of days overdue. A property can appear fully occupied while still producing weak cash flow if collections are inconsistent. This is why disciplined tenant screening, clear lease terms, follow-up, and escalation procedures matter as much as marketing the unit.
For remote investors, collection performance also answers a simple question: Is the property being managed actively, or is someone only reporting after a problem has become serious?
Occupancy and Vacancy Days
Occupancy is not only a percentage. It is lost income measured in days. Track the number of occupied days, vacant days, and days between a tenant giving notice and a new lease beginning.
A short vacancy may be the right decision if a unit needs cleaning, repainting, repairs, or better tenant selection. Rushing to fill an apartment with an unqualified tenant can cost much more than a few extra days without rent. The goal is not maximum occupancy at any price. The goal is stable occupancy with reliable tenants and rental rates that match the market.
It also helps to compare each unit’s vacancy period with the portfolio average. If one apartment repeatedly takes longer to rent, the issue may be pricing, photographs, furniture, layout, location, or the condition of the property.
Net Operating Income
Net operating income, often called NOI, is rental income after operating expenses but before financing costs and income taxes. It shows what the property itself is producing before the investor’s personal debt structure is considered.
For a straightforward calculation, begin with collected rent and subtract recurring operating expenses: management, routine maintenance, cleaning, utilities paid by the owner, building fees, leasing costs, and other property-level expenses. Use consistent categories each month so the number remains comparable.
NOI is especially useful when reviewing potential acquisitions or deciding whether to hold, improve, or sell an existing unit. Gross rent can make an investment look attractive. NOI shows whether the income remains strong after the real cost of operating the apartment.
Maintenance Cost and Repair Status
Maintenance is where remote ownership can feel least predictable. A dashboard should show each open issue, the date it was reported, the current status, the expected cost, and the final approved cost once work is complete.
Track maintenance spend as a percentage of collected rent over time. One repair does not necessarily signal a problem. But repeated plumbing calls, appliance failures, water damage, or tenant-caused issues may point to a larger concern that needs a permanent solution.
Speed matters too. A small leak left unresolved can lead to damaged finishes, unhappy tenants, vacancy, and conflict with neighbors or building management. The dashboard should show whether issues are being closed quickly, not just whether money has been spent.
Lease Expirations and Renewal Rate
Lease expiration dates are operational deadlines. When they are missed, a property manager loses time to discuss renewal terms, assess the apartment’s condition, prepare marketing, and reduce vacancy risk.
A strong dashboard flags leases 60 to 90 days before they end. This allows the management team to review tenant performance, inspect the unit when appropriate, consider a rent adjustment, and plan the next step.
The renewal rate should be read with judgment. High renewals can mean tenants are satisfied and the property is stable. They can also mean rents have not been reviewed against the market. Low renewals may reflect poor tenant quality, but they may also be normal in areas with short-term professional demand. Context matters.
How to Use the Dashboard Without Micromanaging
The best dashboard does not pull an owner into daily operations. It creates a rhythm for oversight. Most investors need a monthly review, with immediate reporting only for material issues such as extended nonpayment, major repairs, property damage, legal action, or an unexpected vacancy.
During the monthly review, focus on exceptions. Ask why rent collected differs from scheduled rent, why a unit is vacant, why maintenance is above its normal range, or why a lease has not been renewed. If performance is on plan, there is no benefit in spending time on every routine task completed behind the scenes.
For a growing portfolio, compare properties against each other. A studio in one new-build complex may have a different tenant profile and expense pattern than a larger apartment in another neighborhood. The dashboard should make those differences visible without pretending every unit should perform identically.
Building a Dashboard That Produces Decisions
A rental property KPI dashboard is useful only when every number has an owner, a source, and a next action. Rent data should come from actual collection records, not assumptions. Maintenance data should be supported by work status and invoices. Vacancy should be tied to leasing activity, not simply marked as “being advertised.”
Owners should also agree with their management team on reporting definitions. For example, decide whether a repair is recorded when approved, when completed, or when paid. Decide how security deposits, owner-funded improvements, and furnishing purchases are treated. Consistency prevents confusion when comparing month to month.
Property Management Georgia uses this operating mindset to help owners stay informed without carrying the daily burden themselves. The objective is not more reporting for its own sake. It is faster action on the issues that protect occupancy, tenant quality, and net returns.
A property dashboard cannot prevent every vacancy or repair. What it can do is make the cost of delay visible early, when there is still time to make a practical decision and keep your investment working.